Geomagnetic Observatory - Part 3

Intro
In this post I will answer the question: can you detect disturbances in the earth’s magnetic field using a cheap magnetometer and a Raspberry Pi? I will try to condense weeks of tinkering and testing down into a few paragraphs describing how I managed to get real measurements from the sensor. After that I will look at some of my data and compare it with data from a real USGS observatory to see how it compares to actual scientific measurements. The RM3100 sensor I purchased from Amazon came with a link to a datasheet and some example code written for some other type of development board in C. I could find little reference to this sensor on any other blog or forum, except for one seemingly unfinished project on Github. I was not able to glean anything useful from the example C code, but I took some cues from the datasheet and followed an example sequence diagram and after a couple weeks of trial and error, I was able to establish that my python code was working and that my measurements were indeed valid. This all comes at a time when geomagnetic activity has been peaking, and in addition to some cool Aurora Borealis photos, I have also captured some cool data that has confirmed the validity of the measurement.
Connection
The first thing I did was hash out the connection to the Pi via SPI interface, but before I could make a successful connection, I needed to solder the board in place.
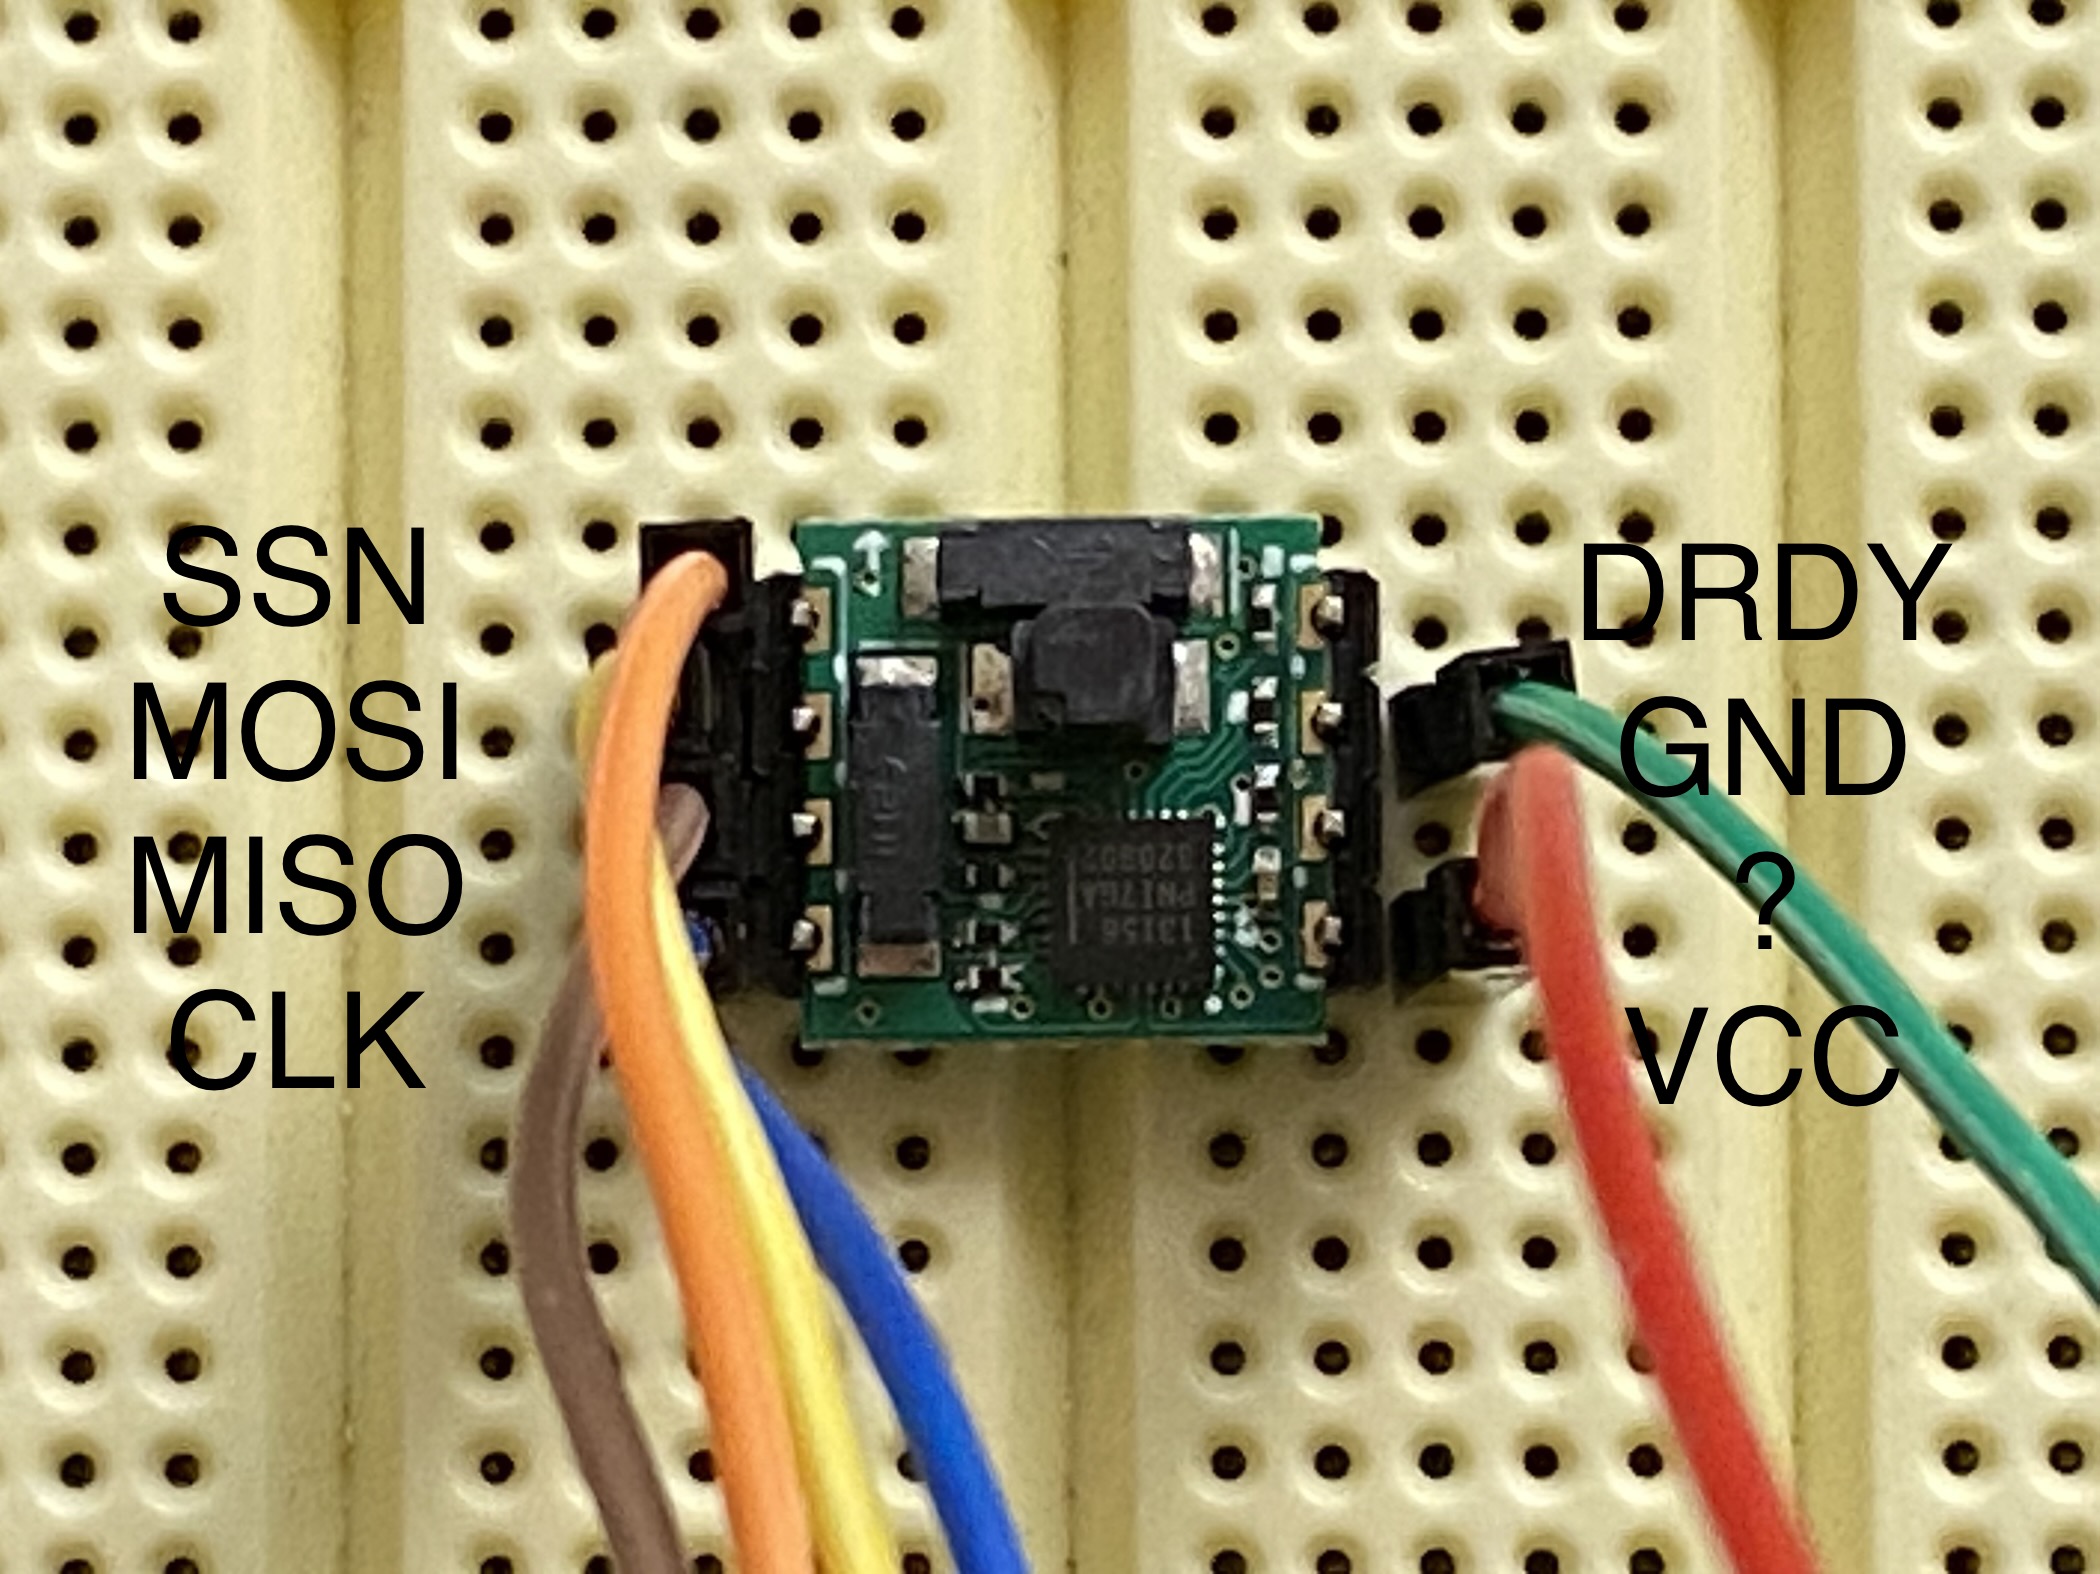
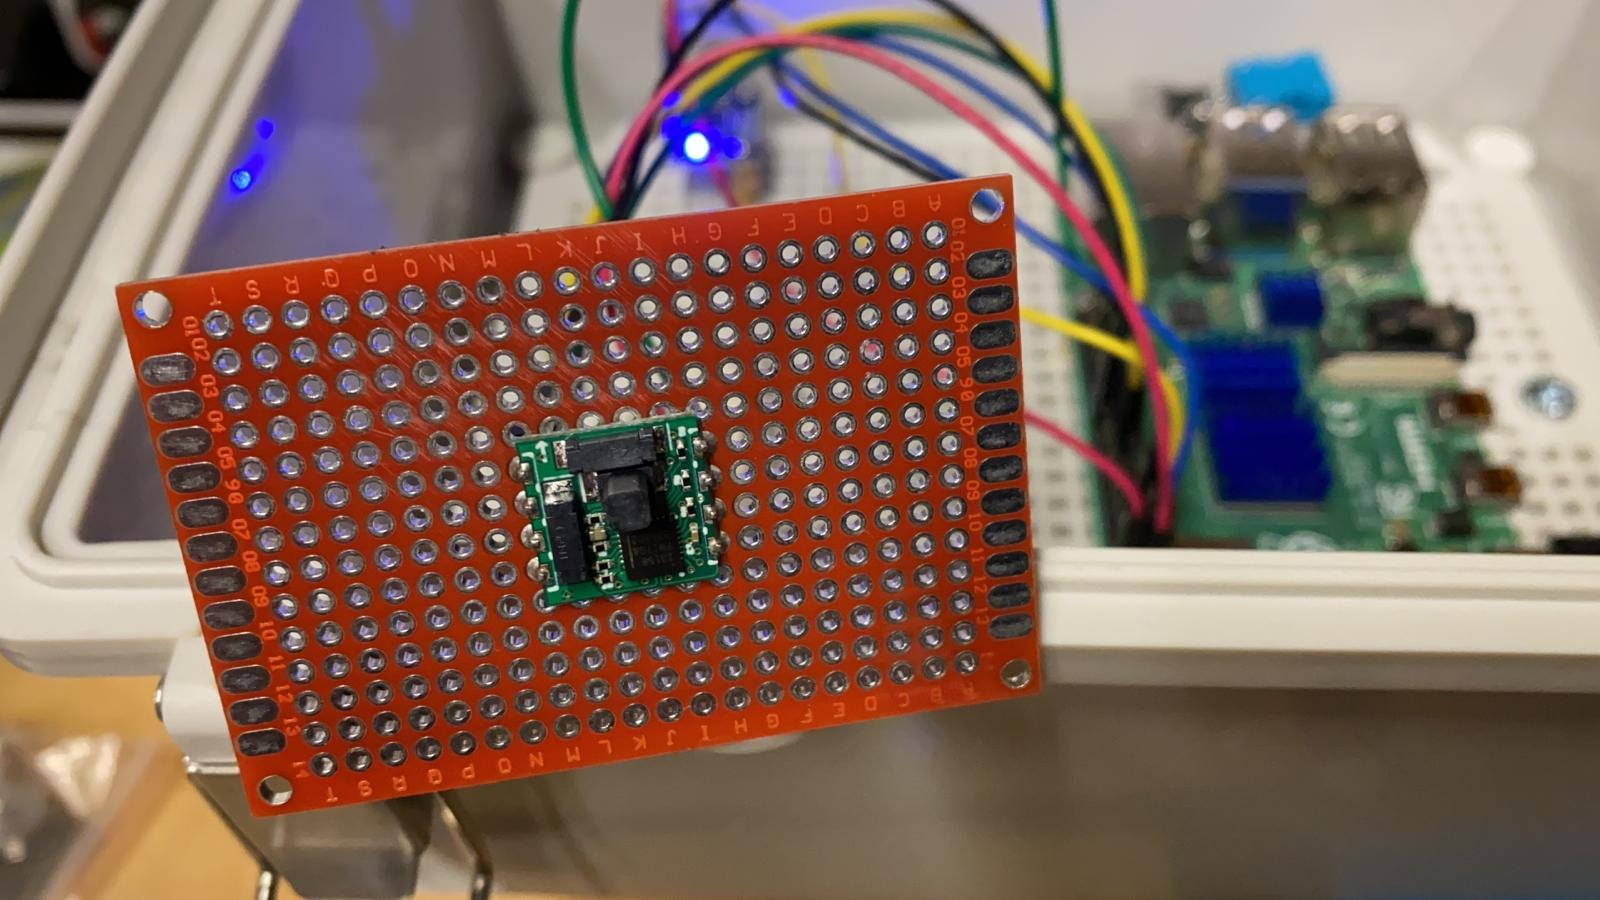
The RM3100 board (I would almost call it a chip because it is so tiny) came configured with castellated vias – something that I had never soldered before. I was able to solder in some header pins through an empty perforated project board with plated thru holes, the opposite side of which the RM3100 was situated, receiving the short side of the pins. Using plenty of flux paste and a high wattage soldering iron, I was able to get the solder to flow into place quickly, cleanly and without burning any of the components or my fingers. A breadboard acted as a fixture for the pins while soldering them in place. I had to use a helping hand magnifying glass however because of the tiny nature of such a soldering job and the fact that my vision is not what it used to be.
Take a single measurement
The steps to make a measurement from the RM3100 are as follows:
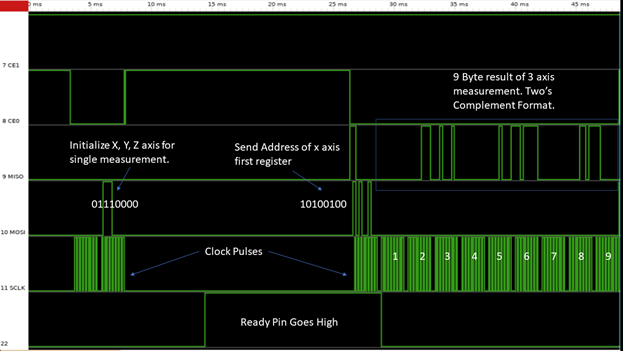
- Initiate a single measurement by sending an 8 bit code with the axes that you want to read.
- 0ZYX0000 is the byte format, with a 1 or a 0 in the Z, Y or X place to specify that a measurement should be made on that particular axis.
- I want to read all 3 axes, so the byte code I use is: 01110000, which converted to hexadecimal value (for use in python code) is 0x70.
- Confirm new data ready.
- DRDY is the “ready” pin on the chip. I connected this to one of the inputs (GPIO 22) on the Pi and am checking the status of the pin.
- Normally, I would write a for loop to wait until data is ready, but I had some issues in doing that. So instead, I input an arbitrary wait time (time.sleep) before reading the DRDY pin once just for confirmation.
- Rather than reading the DRDY pin status, it is also possible to read the status register. I preferred to read the physical pin so that I could see the virtual oscilloscope output with PiScope.
- Read the measurement results.
- To read the results of all the axes, all you must do is clock out a single byte with a hexadecimal value of A4. This is the address of the first part of the x-axis registers. The chip will then immediately send back 3 bytes for each axis (9 bytes total).
- In order to receive those 9 bytes, the Pi has to clock out 9 null bytes.
- The three bytes of each axis then must be concatenated together.
- If the three bytes are “01111111” “10101010” “00000011” then the result for that axis would be “011111111010101000000011”
- This value is encoded in Two’s Complement format, which allows for negative values in binary.
- After conversion back to base 10, the number tends to range from 3000 to 5000 and is linearly proportional to the magnetic field.
- Calculate total field value, the root sum square of the 3 axis values.
Single Measurement Sequence (PiScope Output)
Here is what the measurement sequence looks like on the pins.
Python Code
Here is a link to the python code I wrote for the RM3100 sensor and Raspberry Pi.
Testing
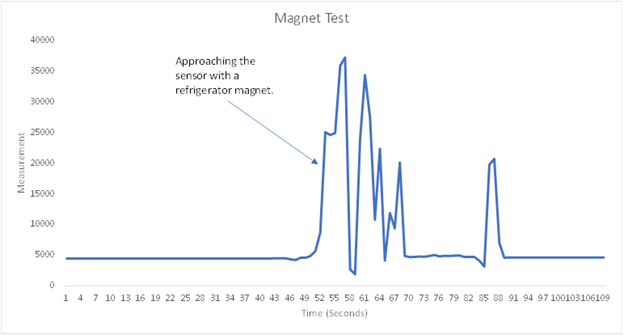
I spent a lot of time over several weeks trying to validate the output from the sensor. The data sheet was less than clear about exactly how to decode the results and only through trial and error was I able to confirm, at least in my mind, that I was properly reading the bits. Something I realized during this process was that the output is merely proportional to the magnetic field strength and is not a calibrated value. This means that an offset must be applied to the measurement. I remain dubious on whether any gain or scale factor should be applied. One test I performed was with a magnet from the refrigerator, recording data while moving the magnet close to the sensor. Seeing this graph made me think I was going in the right direction.
Noise
As I suspected, there is a lot of noise in the data.
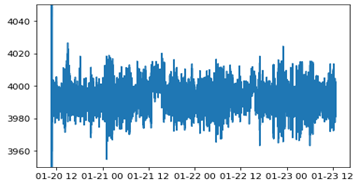
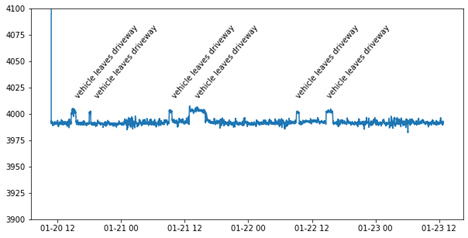
Vehicle Detection
If I apply a rolling mean to the data, it cleans up nicely. At some point during the experiment, I noticed little shifts in the data and realized that it happens when I drive my truck out on an errand. Here you can see when I took kids to school, went to the store, or made a run to the post office. In this set up, the truck was parked outside the garage in the driveway and the sensor was located about 20 ft away inside the garage. As such, vehicle detection has revealed itself as another hidden application for this sensor.
I tried a few things to try and reduce the noise level but the results are inconsistent at best. I have tested it outside in the back yard, but the noise level is still there. It is possibly seeing interference from the transformer that supplies power to our house.
Link to Jupyter Notebook with a comparison of the noise level from the different set-ups I have tried.
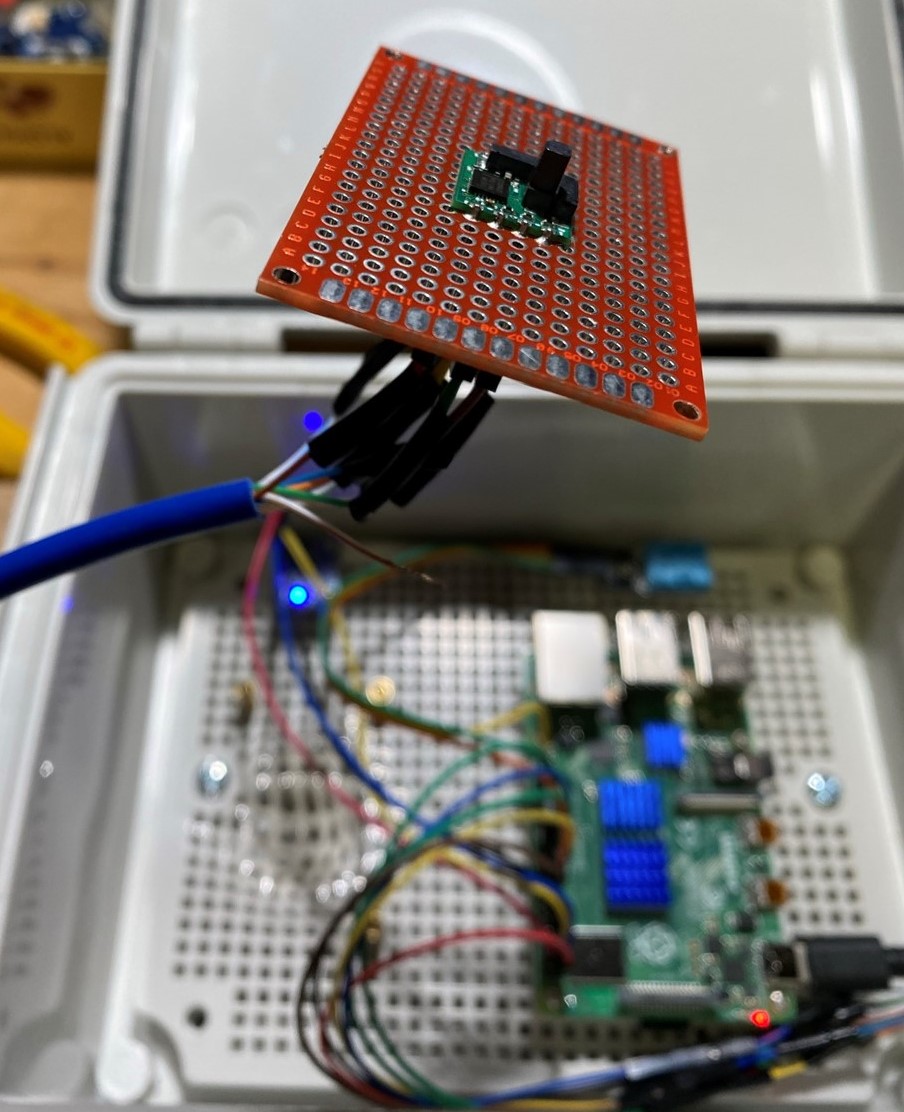 I made a crude GPIO extension with an ethernet cable. This was to provide distance from the Raspberry Pi and other electronics in the enclosure.
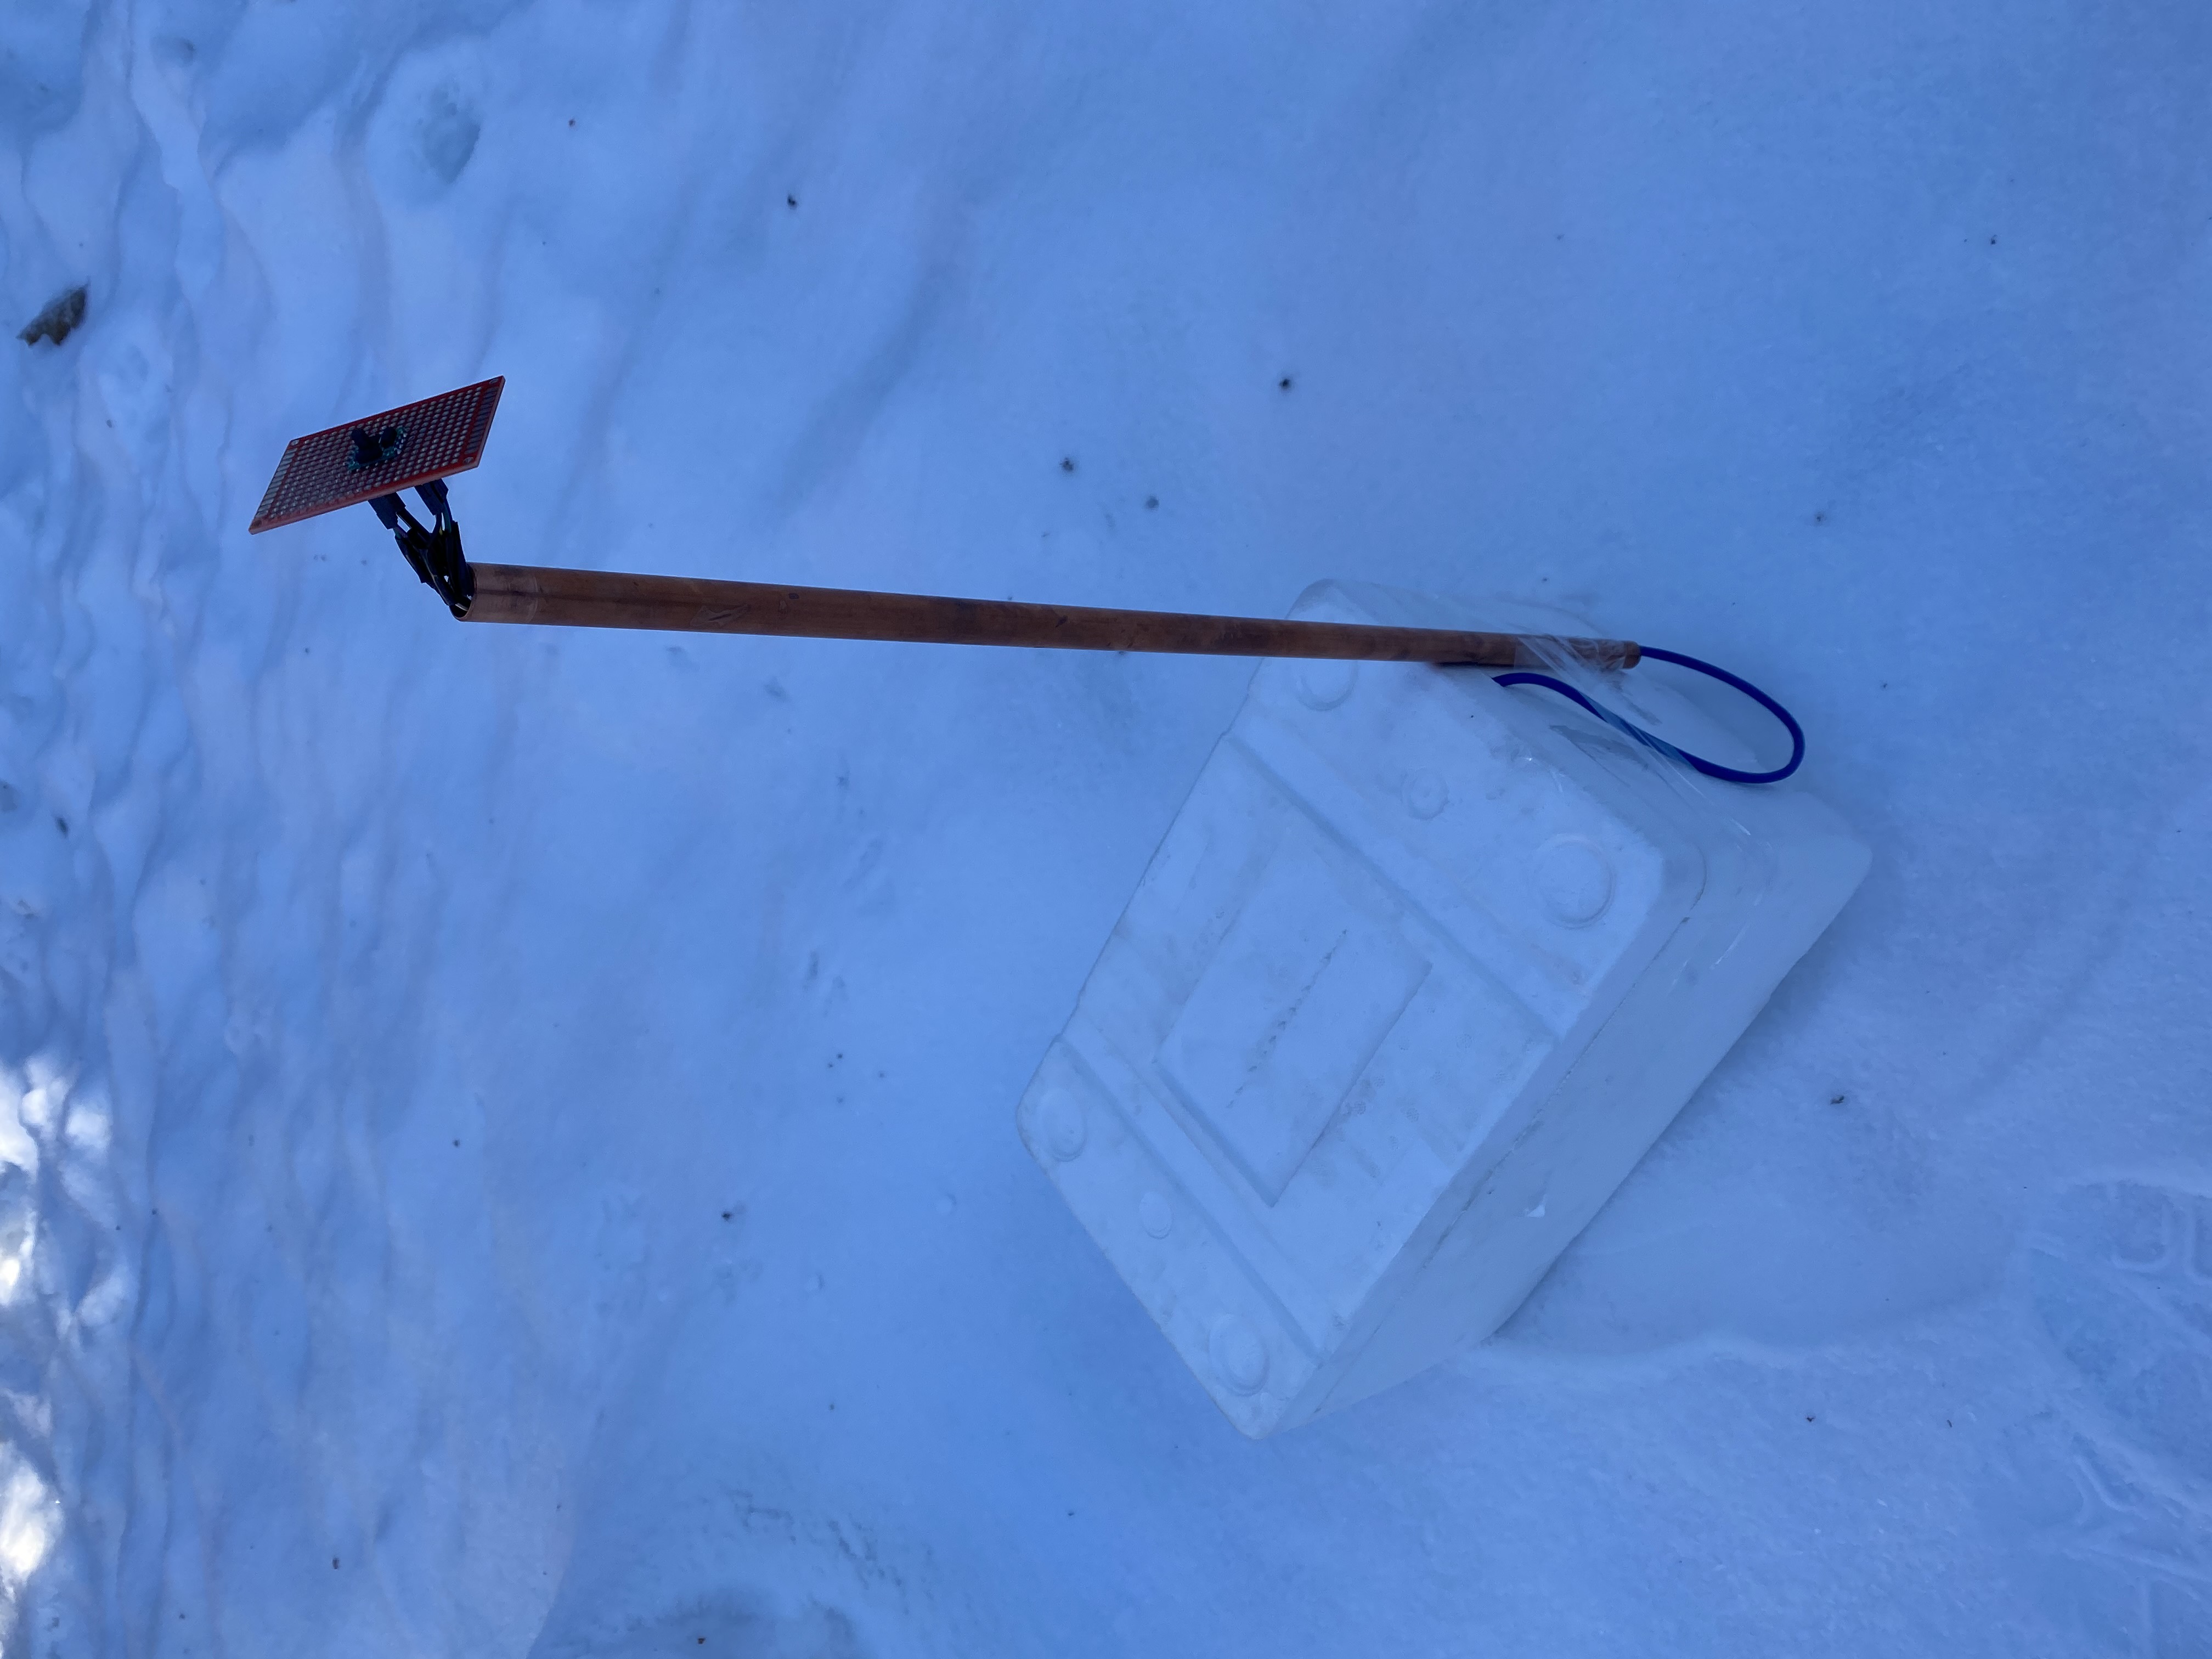 Here’s the test set up in the back yard using a copper pipe as a sort of stand for the sensor, to keep it away from the electronics. There was still quite a bit of noise, however.
Gather more data
Despite the noise levels I still needed to collect more data to prove whether the earth’s magnetic field fluctuations could be detected. I had started to doubt myself and if this thing would work at all. Then my family and I took a trip to Fairbanks for my birthday and were lucky enough to do so during a period of high geomagnetic activity. Before leaving home, I positioned the sensor near a window in the kitchen and let it run.
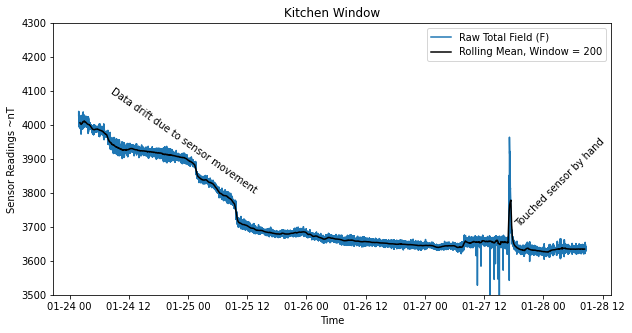
When we came back I was excited to take a look at the data because I knew there had been a lot of activity, as evidenced by my photo at the top of this page. I was a little bit disappointed seeing the amount of drift that seems to have happened. The sensor had moved while we were away and I believe that is why the drift occurred.
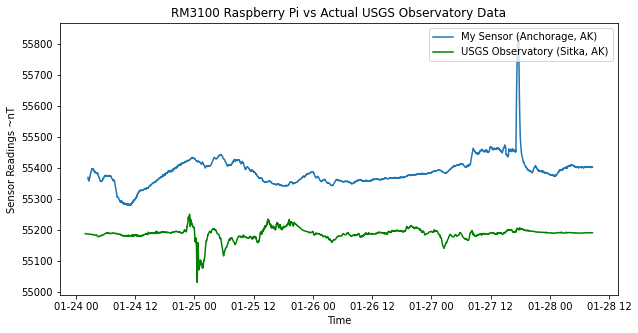
Here is a first look at how my data compares with the USGS Sitka observatory data. See how I straightened the data: Link to Jupyter notebook.
Summary
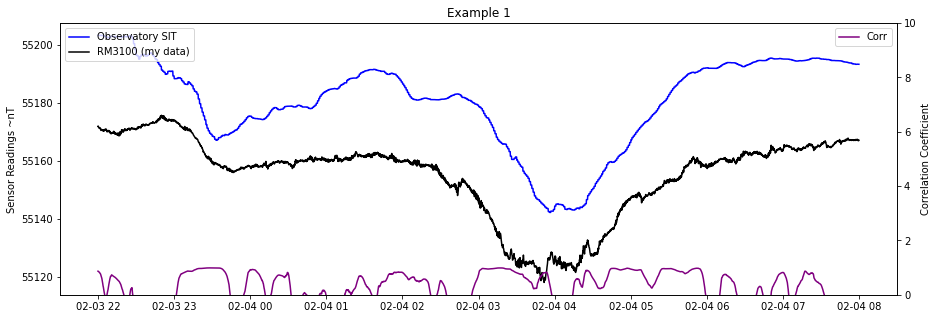
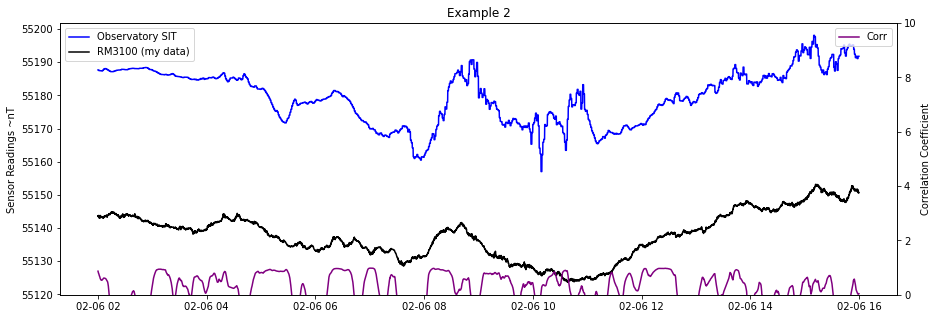
For the next data sets, I moved the sensor and Pi box to the floor of the garage as far away from the furnace as I could. I then let it run for several days, and during that time I managed to capture some remarkably interesting data that demonstrates how well the RM3100 sensor can detect geomagnetic activity. It does so rather well in my opinion!
For more details on these comparisons, check my Jupyter notebook.
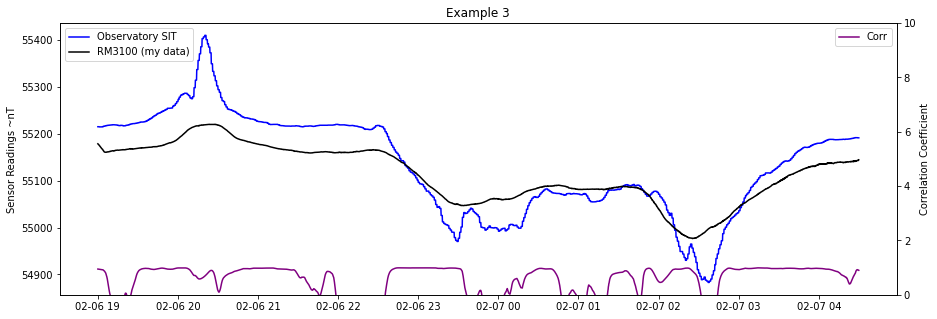
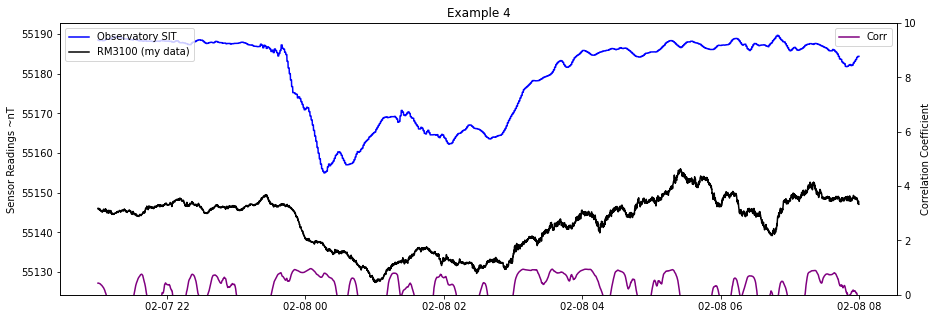
Conclusion
I think this data provides enough evidence for me that the RM3100 performs reasonably well as a geomagnetic sensor. I think there is a strong enough correlation between my data and the USGS data.
There are some physical reasons why my data might have some differences. The main reason is the difference between my location and the observatory. Disturbance fields can change with time, causing a phase shift between large distances.
The RM3100 is likely picking up a lot of man-made interference at my location. A house has a lot of opportunity for magnetic interference with vehicles, electric motors, transformers, etc. I would be interested in trying to take the Raspberry Pi a few miles out of town and logging some data for a couple of hours to see if there is any reduction in the noise level. I think the rolling mean takes care of the noise reasonably well as the noise seems to be cyclical and centered around the true readings. Another solution, suggested by one of my contacts, might be to run a second sensor and use that to cancel out the noise. I really liked this suggestion and still might try it as well.
For now, I think I have accomplished what I set out to do with the testing phase of this project, and I am happy about the results. Thanks for reading this far and please feel free to reach out, either directly or leave me a comment on LinkedIn where I share this blog post.