Timeclock
At some point in my career, I became concerned with tracking my hours worked and being able to show whether or not I was at the office for the required number of hours each day. Let’s see if we can use our Google Location History to back up our story and prove that we were justified in taking off early on Friday afternoon.
Thought process
We know that we can get the history of our lat/long for as long as we’ve used a smartphone with google maps. With that, we can set a point of interest like an office building with a known lat/long. Then we can ask ourselves the following question: How much time do I spend each day within a given radius of that point? The distance between lat/long coordinates can be found with the haversine formula. Luckily someone already did the hard work for us:
from math import radians, cos, sin, asin, sqrt

def haversine(lon1, lat1, lon2, lat2):
    """
    Calculate the great circle distance between two points
    on the earth (specified in decimal degrees)
    """
    # convert decimal degrees to radians
    lon1, lat1, lon2, lat2 = map(radians, [lon1, lat1, lon2, lat2])

    # haversine formula
    dlon = lon2 - lon1
    dlat = lat2 - lat1
    a = sin(dlat/2)**2 + cos(lat1) * cos(lat2) * sin(dlon/2)**2
    c = 2 * asin(sqrt(a))
    r = 6371 # Radius of earth in kilometers. Use 3956 for miles
    return c * r
We continue on with our output data frame
(see yesterday’s post)
| timestampMs | timestamp | latitudeE7 | longitudeE7 | altitude | |
|---|---|---|---|---|---|
| 0 | 1.496705e+09 | 2017-06-05 15:26:33 | 61.12345 | -149.45678 | 70.0 |
| 1 | 1.496705e+09 | 2017-06-05 15:25:01 | 61.12345 | -149.45678 | 70.0 |
| 2 | 1.496705e+09 | 2017-06-05 15:24:01 | 61.12345 | -149.45678 | 70.0 |
| 3 | 1.496705e+09 | 2017-06-05 15:22:36 | 61.12345 | -149.45678 | 70.0 |
| 4 | 1.496705e+09 | 2017-06-05 15:21:36 | 61.12345 | -149.45678 | 70.0 |
Now we can add a distance column to our dataframe, filtering out values greater than a certain distance and finally group by date to get our daily hours worked.
Calculate a time delta
A time delta is used to find the time difference between each record in the data which can then be summed by day. I used to use .fillna(0) but pandas no longer accepts an integer here if the data is of datetime64 format. Instead of 0 we now use pd.Timedelta(seconds=0)
output['tdelta'] = (output.timestamp - output.timestamp.shift()).\
    fillna(pd.Timedelta(seconds=0))
output['tdelta'] = output['tdelta'] / np.timedelta64(1, 'm')
Enter a point of interest
ilat = 61.12345
ilong = -149.45678
Radius
Choose a radius large enough to include all points within the area of interest. In this case, 250 meters covers the building and parking lot where I worked.
radius = 250 #Meters
radius = radius / 1000 #Kilometers
Calculate the distance
This is the distance from the point of interest of every coordinate in the google history file.
output['distance'] = output.apply(lambda x: haversine(ilong, ilat, \
    x.longitudeE7, x.latitudeE7), axis=1)
Filter by distance and group by date
output['date'] = output['timestamp'].dt.floor('d')
output['tdelta'] = output['tdelta'] / 60  #minutes to hours
output = output[output['distance'] < radius]
output = output[['date', 'tdelta']]
output = output.groupby(output['date']).sum()
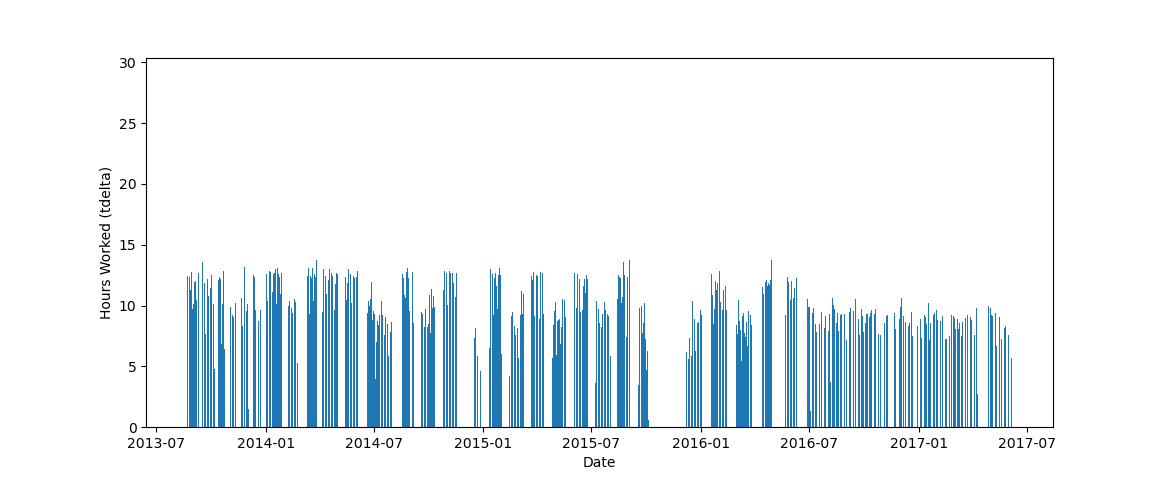
Plot the data
fig, ax = plt.subplots()
ax.bar(output.index, output.tdelta)
ax.axes.set_xlabel("Date")
ax.axes.set_ylabel("Hours Worked (tdelta)")
fig.show()
Now we have our data summarized by day and we can take a quick look for any interesting trends and QC the data in general.
I think that is as far as I’ll take this project for now. Later on I might try to put together some sort of dashboard or report that could be used on a regular basis.